Dairy farm input costs continue volatility
Feed costs for farmers in US and charges for replacement cows escalate since COVID-19.

Photo courtesy of NVS / iStock / Getty Images Plus

We have seen some very dramatic fluctuations in dairy farm input costs in the past four years, and while some costs have come down, not all of them have and most remain elevated compared to pre-pandemic levels. Farm input costs are important because they are the starting point for prices further down the dairy supply chain like milk, cheese, butter and the various powders.
Technically, the cheese market doesn’t care what the dairy farmer must pay for corn and dairy prices often fall below the cost of production for farmers, but when farmers start losing money, they cut supply, which limits how far dairy prices can fall. So, the price transmission from input prices to dairy product prices is long and lagged, but it is important to understand what is happening with input prices for farmers if we want to understand what is happening in the dairy markets.
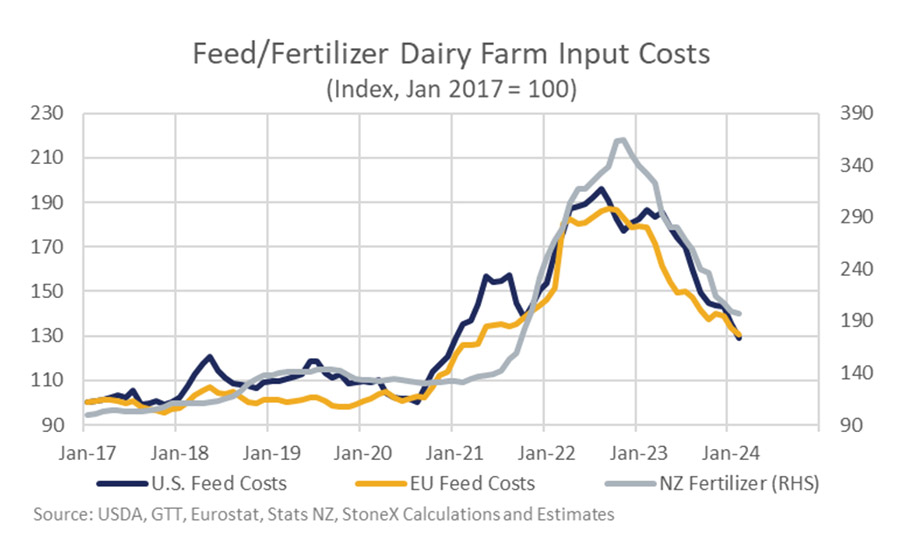
Feeds costs major cost in milk production
Feed costs often make up 40 to 60% of the cost of producing milk. Feed costs were trending up in 2021 on the back of good demand and production issues is various parts of the world, but the rise in prices was turbo charged by Russia’s invasion of Ukraine. From mid-2020 to the peak in June 2022, feed costs for the average U.S. dairy farm rose 86%. European dairy farmers rely more on their homegrown feed more than U.S. farmers, but feed costs in Europe rose by a similar percentage and dairy farmers there felt the pinch too.
Dairy farmers in New Zealand primarily rely on pasture to feed their cows, so they were more isolated from the spike in feed costs, but they do apply fertilizer to the fields to help the grass grow. Fertilizer typically accounts for 7-10% of the average costs on a New Zealand dairy farm and from mid-2020 to the peak in late 2022, imported fertilizer costs rose 174%. Russia and Belarus are major exporters of fertilizer and the fear was that the supply would be cut off.
Fertilizer continued to flow out of Russia and Belarus and exports of various crops continued to move out of Ukraine, which helped to bring prices for these items down since 2022. U.S. feed costs are down about 34% from the peak while the EU price is down 30% and fertilizer imported into New Zealand is down 41%. However, not all costs have come down and some have been increasing since 2022.
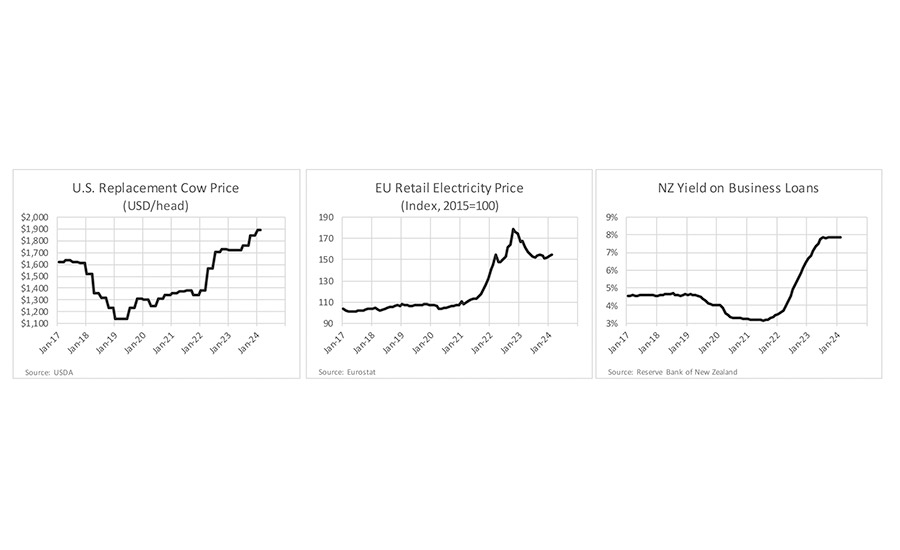
As the graphs demonstrate, In the U.S., the cost of replacement cows has been rising since early 2019. The USDA reported price lags the market and isn’t at a new record high yet, but it could hit a new record high during 2024. U.S. dairy farmers have been reducing the number of heifers they raise to cut costs and increase revenue by selling more calves into beef raising operations.
How is debt of farmers in New Zealand impacting milk prices?
In the EU, energy prices spiked in 2022 on the back of reduced natural gas supplies coming from Russia. Retail energy prices have pulled back from their 2022 peak but remain well above pre-war levels, which raises costs for dairy farmers and processors in the region. Lastly, and this one actually applies to all regions, but I’ve included a graph for New Zealand, interest rates remain near their peak. New Zealand dairy farmers generally carry more debt than the average dairy farm in the U.S. or EU with interest expense making up 13-20% of the cost of milk production in the country. So, the near tripling of effective interest rates since the pandemic has a significant impact on their operating costs.
Input costs for dairy farmers are mostly down since their peak in 2022, but they still aren’t down to pre-pandemic levels and some input costs are still increasing or remain near recent highs. The generally elevated input costs mean milk prices can only fall so far before dairy farmers see margins turn negative which usually slows milk production growth.
This material should be construed as the solicitation of an account, order, and/or services provided by the FCM Division of StoneX Financial Inc. (“SFI”) (NFA ID: 0476094) or StoneX Markets LLC (“SXM”) (NFA ID: 0449652) and represents the opinions and viewpoints of the author. It does not constitute an individualized recommendation or take into account the particular trading objectives, financial situations, or needs of individual customers. Additionally, this material should not be construed as research material. The trading of derivatives such as futures, options, and over the counter (OTC) products or “swaps” may not be suitable for all investors. Derivatives trading involves substantial risk of loss, and you should fully understand the risks prior to trading. Past results are not necessarily indicative of future results.
All references to and discussion of OTC products or swaps are made solely on behalf of SXM. All references to futures and options on futures trading are made solely on behalf of SFI. SXM products are intended to be traded only by individuals or firms who qualify under CFTC rules as an ‘Eligible Contract Participant’ (“ECP”) and who have been accepted as customers of SXM.
SFI and SXM are not responsible for any redistribution of this material by third parties, or any trading decisions taken by persons not intended to view this material. Information contained herein was obtained from sources believed to be reliable but is not guaranteed as to its accuracy. Contact designated personnel from SFI or SXM for specific trading advice to meet your trading preferences.
Reproduction or use in any format without authorization is forbidden.
© Copyright 2024. All rights reserved.
Looking for a reprint of this article?
From high-res PDFs to custom plaques, order your copy today!