High-protein, natural are trending in beverages


High protein and natural are most likely to be the latest trends for 2015, according to Beverage Industry’s annual New Product Development Outlook survey. (Beverage Industry, like Dairy Foods, is published by BNP Media, Troy, Mich.)
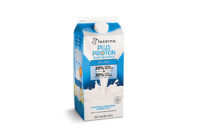
The “high protein” attribute made significant strides in this year’s survey, moving up to No. 1 from the No. 10 spot, with 42% of survey takers listing the attribute as a latest trend. Last year, “healthy” was the leader. It fell two spots this year.
Many survey-takers indicated that dairy-based and dairy-alternative drinks will be a category of focus. Forty-two percent named the category as an area of new product development. This is up from the 35% that listed the category last year. Sports and energy drinks declined six percentage points to take the No. 2 position, while coffee and tea declined nine percentage points to round out the Top 3. Seeing double-digit declines in new product development were the water and juice categories, with only 24% of respondents listing the categories compared with 41% last year.
Not-so-popular attributes
One attribute that saw significant contraction was “organic.” With 27% of respondents naming this attribute as a latest trend last year, only 18% listed it as such this year, dropping it from No. 3 to No. 8. This year’s survey also saw “low glycemic” (No. 7 last year) and “low fat” (No. 9 last year) drop out of the Top 10, being replaced with “probiotic/prebiotic” (No. 6) and “vitamin, mineral fortified” (No. 10).
Although “low glycemic” was not in the Top 10 for latest trends, it still was recognized by many survey-takers as a high need/interest for consumers. Other attributes also receiving this designation were “beauty enhancing,” “cognitive health,” “country of labeling,” “ethnic,” “Fair Trade,” “low salt,” “indulgent” and “portion controlled.”
Attributes that ranked as having a low need/interest were “bone health” and “relaxation benefits.”
When selecting which flavors they wanted to utilize, survey-takers opted for more traditional options in 2014, with orange, vanilla, lemon, strawberry and peach rounding out the Top 5. Orange’s usage jumped up eight percentage points this year to 49%. Tied with orange at 49%, vanilla’s usage remains fairly consistent with last year’s survey, seeing an increase of one percentage point.
Flavors from last year’s Top 10 that saw contractions in 2014 were mango (down three percentage points), raspberry (down eight percentage points), apple (down four percentage points) and fruit punch (down 17 percentage points).
Making up for some of these drop offs were lime (up seven percentage points), berry (up eight percentage points) and coffee (up six percentage points).
Chocolate is a best-seller
Although orange was the most-used flavor in 2014, it did not come in as the top-selling flavor for the year. Taking the top spot was chocolate at 29%. Although chocolate moved up only one spot from No. 2 to No. 1 compared with last year’s survey, its percentage point increase was 15. Taking a hit, however, was strawberry. Last year’s No. 1 top-selling flavor dropped out of the Top 10 as the percentage of respondents listing it as a top-selling flavor dropped from 25% to 7%.
However, not all flavors saw such a strong drop off in 2014. Vanilla moved up one spot to the No. 2 top-selling flavor after seeing its percent usage increase from 14% to 24%. Mango also had a positive year, jumping from No. 10 to No. 3. The tropical flavor saw its reported sales status increase from 10% to 22%.
This year’s survey also saw a handful of new flavors make the Top 10 list. Raspberry, coffee, black tea, orange and peach all made the top-selling flavors in 2014 list, knocking out apple, berry, fruit punch, lime and, as previously mentioned, strawberry.
The length of time to develop a new product also saw an uptick in this year’s survey, with mean time from inception to launch equating to 11 months. This is up from last year’s nine months; however, one-third of this year’s respondents noted that this is faster for them than in previous years.
Total cost to new product development also experienced some fluctuations between the two surveys. This year’s had a mean and median of $209,080 and $37,500, respectively. Last year’s respondents had a mean of $348,717 and a median of $20,000. However, when it came to R&D budget comparisons, the numbers were fairly similar, with 44% listing an increase in their budget versus 41% last year.
Beverage Industry’s New Product Development Outlook survey was conducted by BNP Media’s Market Research Division. The online survey was conducted between Sept. 29 and Oct. 13, 2014. See more at bevindustry.com.
Looking for a reprint of this article?
From high-res PDFs to custom plaques, order your copy today!


